
How to Study Statistics (When the Formulas Feel Random)
By Imran Al-Ameen Adebayo · Founder of BrainDrill · 12 July 2026 · 6 min read
Statistics has a strange reputation: easier than calculus on paper, yet it produces just as many casualties. The reason is that stats hides its real skill — translation. The formulas are few and mechanical; converting a paragraph about factory defects into "binomial, , , " is the entire game.
See the three questions underneath everything
Every topic in an intro course answers one of three questions: Describe (what does this data look like — mean, median, spread, shape), Model (what process could have produced it — binomial, Poisson, normal), and Infer (what does my sample say about the population — intervals, tests). File each new lecture under its question and the course stops feeling like a formula heap.
Descriptive stats: know what breaks each measure
The mean chases outliers; the median ignores them; the standard deviation measures spread around the mean and inherits its outlier problem. Exams love "which measure is appropriate and why" — the answer is always about robustness and shape, not preference.
Distributions: learn the fingerprints
- Binomial: fixed number of yes/no trials, constant probability — .
- Poisson: counts of rare events in a window of time or space.
- Normal: continuous, symmetric, and everywhere — thanks to the central limit theorem, sums and means of almost anything drift normal.
Drill the recognition: read the problem, name the distribution, state its parameters — before touching any formula. That three-step habit is most of a stats grade.
The sampling distribution: the course's one big idea
Take many samples and compute each one's mean: those means have their own distribution, centred on the true mean with spread . Everything in inference — the -score, the confidence interval , the p-value — is just geography on this distribution. Spend twice the time here that the syllabus suggests; it converts the entire second half of the course from recipes into one picture.
Hypothesis tests: one ritual, many costumes
Every test is the same five steps: state and , choose the test from your decision tree, compute the statistic, find the p-value, conclude in the words of the problem. Examiners reserve marks for that final sentence — "we reject " earns less than "the data provide evidence the new process reduces defects." Practise writing conclusions as carefully as computing statistics.
A drill system for a translation-heavy course
- Mixed word problems from week three onward — problems grouped by chapter do the translation for you, which is exactly the skill you need to train.
- Blank-paper re-solves of every missed problem, 48 hours later.
- Error log by cause: wrong distribution chosen vs wrong parameter vs arithmetic — each has a different cure.
- Explain one solution aloud daily — statistics reasoning is verbal; if you can't say why a test applies, you don't own it yet. When a step won't click, get it explained step-by-step immediately and then re-derive it solo.
Frequently asked questions
Why does statistics feel harder than other math courses?+
Because the difficulty is translation, not computation. Every stats problem is a word problem: the skill being tested is converting a messy sentence into the right distribution, parameter and question. Students who drill translation — not just formulas — are the ones who find the course suddenly easy.
What's the most important concept in an intro stats course?+
The sampling distribution — the idea that a statistic computed from a sample is itself a random variable with its own distribution. Confidence intervals and hypothesis tests are both direct consequences; students who skip this idea end up memorising test recipes they can't adapt.
How do I stop mixing up which test to use?+
Build a one-page decision tree keyed on three questions: What type of data (means, proportions, counts)? How many groups (one, two, many)? What's being asked (estimate, compare, test relationship)? Reproduce the tree weekly from memory and route every homework problem through it explicitly.
Put this into practice with BrainDrill
An AI tutor that shows its work step by step, quizzes generated from your own notes, and live study rooms with friends. Free to start — no card needed.
Try BrainDrill free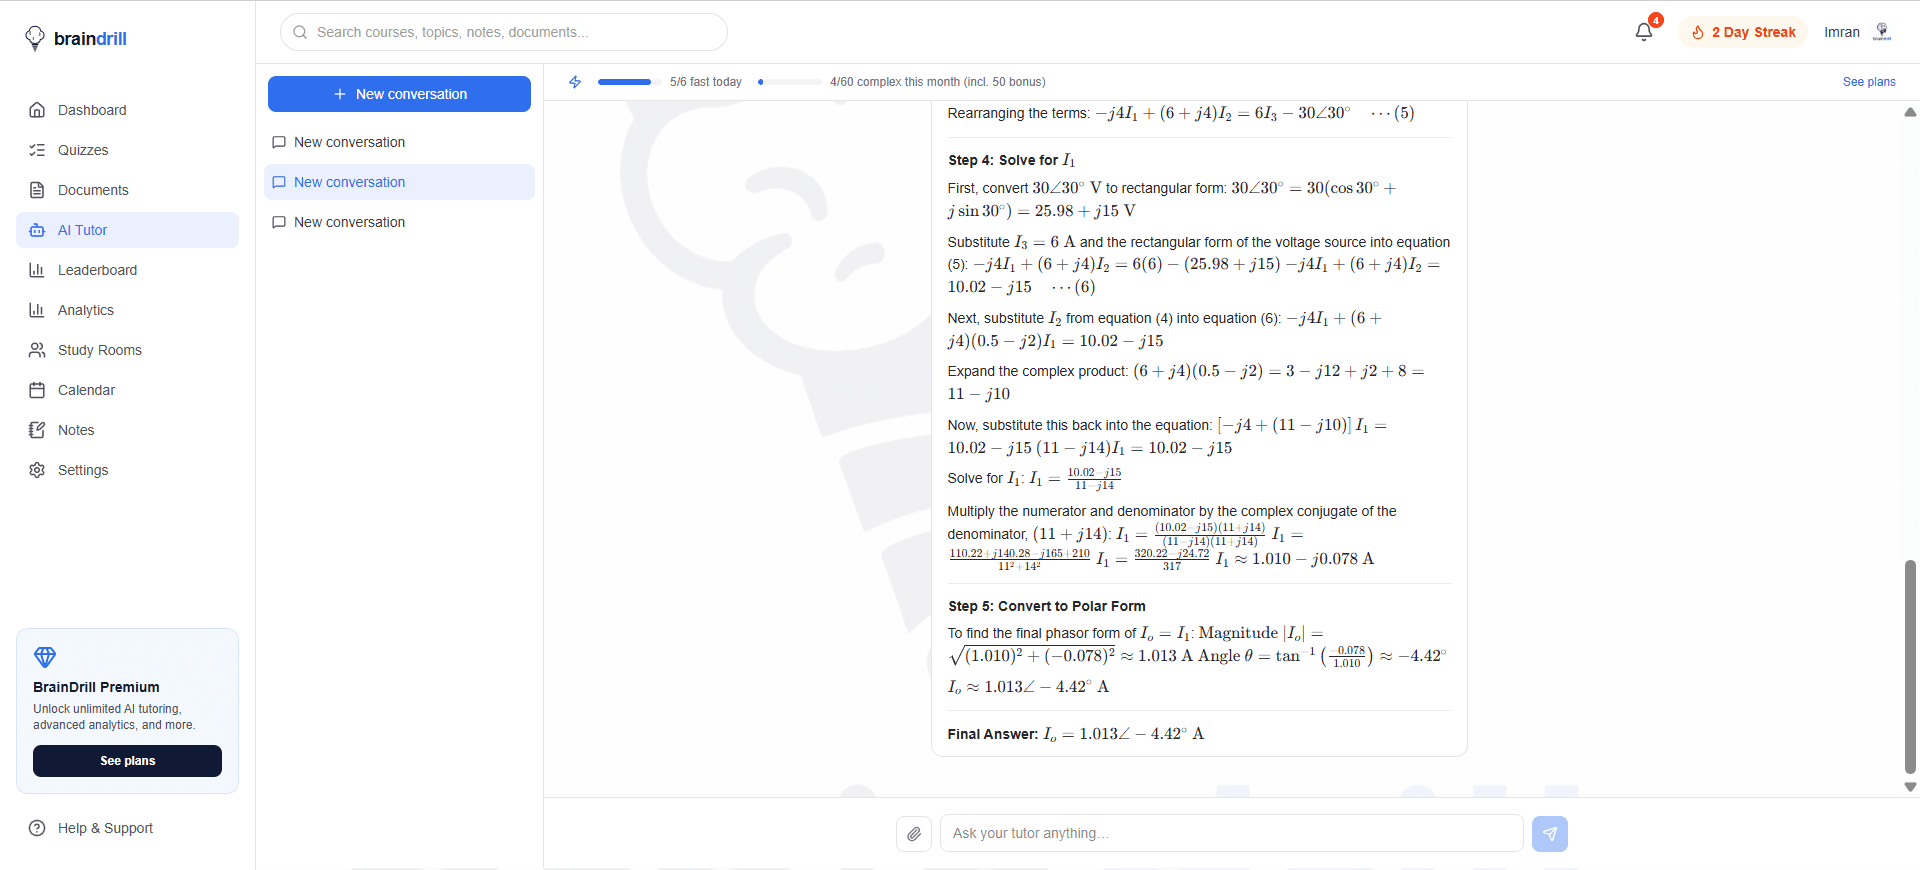
Imran Al-Ameen Adebayo
Engineering student and founder of BrainDrill — building the study app he wished he had. Read his story →
Study smarter, straight to your inbox 📬
One short email a week: a study technique that works, a topic worth drilling, and what's new in BrainDrill. Free, no spam, unsubscribe anytime.